Redundant samples to test reproducibility
In our previous BCAT experiment, we launched samples with volumes in excess of a milliliter, which at certain points have been difficult to synthesize, owing to the difficulty of obtaining particles in the past. The sample chambers in ACE-M2 were specifically chosen to be far smaller, thereby requiring less sample. The final sample volume is a few microliters, more than two orders of magnitude smaller than the samples in BCAT. The large number of sample wells we can then launch in an experiment allows us the capability of redundancy, running multiple wells of the same sample, to understand the variability of the loading, mixing and imaging processes. In principle, the same sample loaded into different wells should yield the same behavior, but this has not been verified carefully.
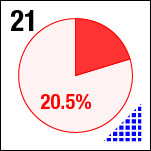
Phase separation sample 21
To test this, we loaded five wells with sample 21, which we expect based on ground studies to undergo phase separation.
Its composition, as previously described:
| Sample number | Sample name | Colloid size | Colloid volume fraction | Polymer concentration |
|---|---|---|---|---|
| 21 | plu_ACEM2_lg_ps | large | 20.5% | 0.153 mg/g |
For each of the five wells, I show a sequence of images at 20x magnification, collected on calendar days 198, 209 and 223, which correspond to days 4, 18 and 32 after mixing. The frames are spaced by 0.5 seconds in the movie, with a 2-second delay at the end, before it repeats (infinitely). All five samples are in platter 2105, but spread out over three different strips.
Strip D-608, Well D1
These images were collected 80 microns in from the cover slip.
Strip E-618, Well E5
These images were collected 80 microns in from the cover slip.
Strip F-613, Well F3
These images were collected 100 microns in from the cover slip.
Strip F-613, Well F4
These images were collected 100 microns in from the cover slip.
Strip F-613, Well F5
These images were collected 80 microns in from the cover slip.
Significant variability
As is clear from the above images, the nominally-same sample looks very different when loaded into different wells. To repeat, the images are all taken at the same resolution; the number of microns in the sample represented by each pixel is consistent across all images, with different croppings resulting from differing amounts of stage displacement through the course of the run.
The sample in wells D1 and E5 show coarsening and displacement of major features, which are ten pixels wide, or greater.
By contrast, the samples in wells F3, F4 and F5 appear not to coarsen much, and have a much smaller characteristic size, a network of small chains that is barely a few pixels across. One might describe these three samples as having a smaller mesh size, or coarsening on a smaller length scale.
Possible causation?
Why might these differences arise? Nominally, the samples should be the same chemically, at least based on the notion that they were all taken from the same vial.
However, the samples were not loaded at the same time. Those in D1 and E5 appear to have been loaded at roughly the same time, in Dec 2013, and look relatively similar; the exact amount of coarsening will differ due to mixing issues and location sampled within the chamber, as we have seen in other wells. Strip F-613 was all loaded at the same time on 8 Jan 2014, and the three wells of sample 21 there all look roughly the same, as well.
So it seems that as long as samples are loaded at roughly the same time, they will behave consistently. In the gap between D1/E5, and F3/F4/F5, something appears to have happened, which we are investigating. I will update this post as we dig deeper through our notes, to understand the source of this significant variation. Stay tuned.